Kubernetes Observability in KubeSphere Allows You to Build Visualizations Simply and Intuitively.
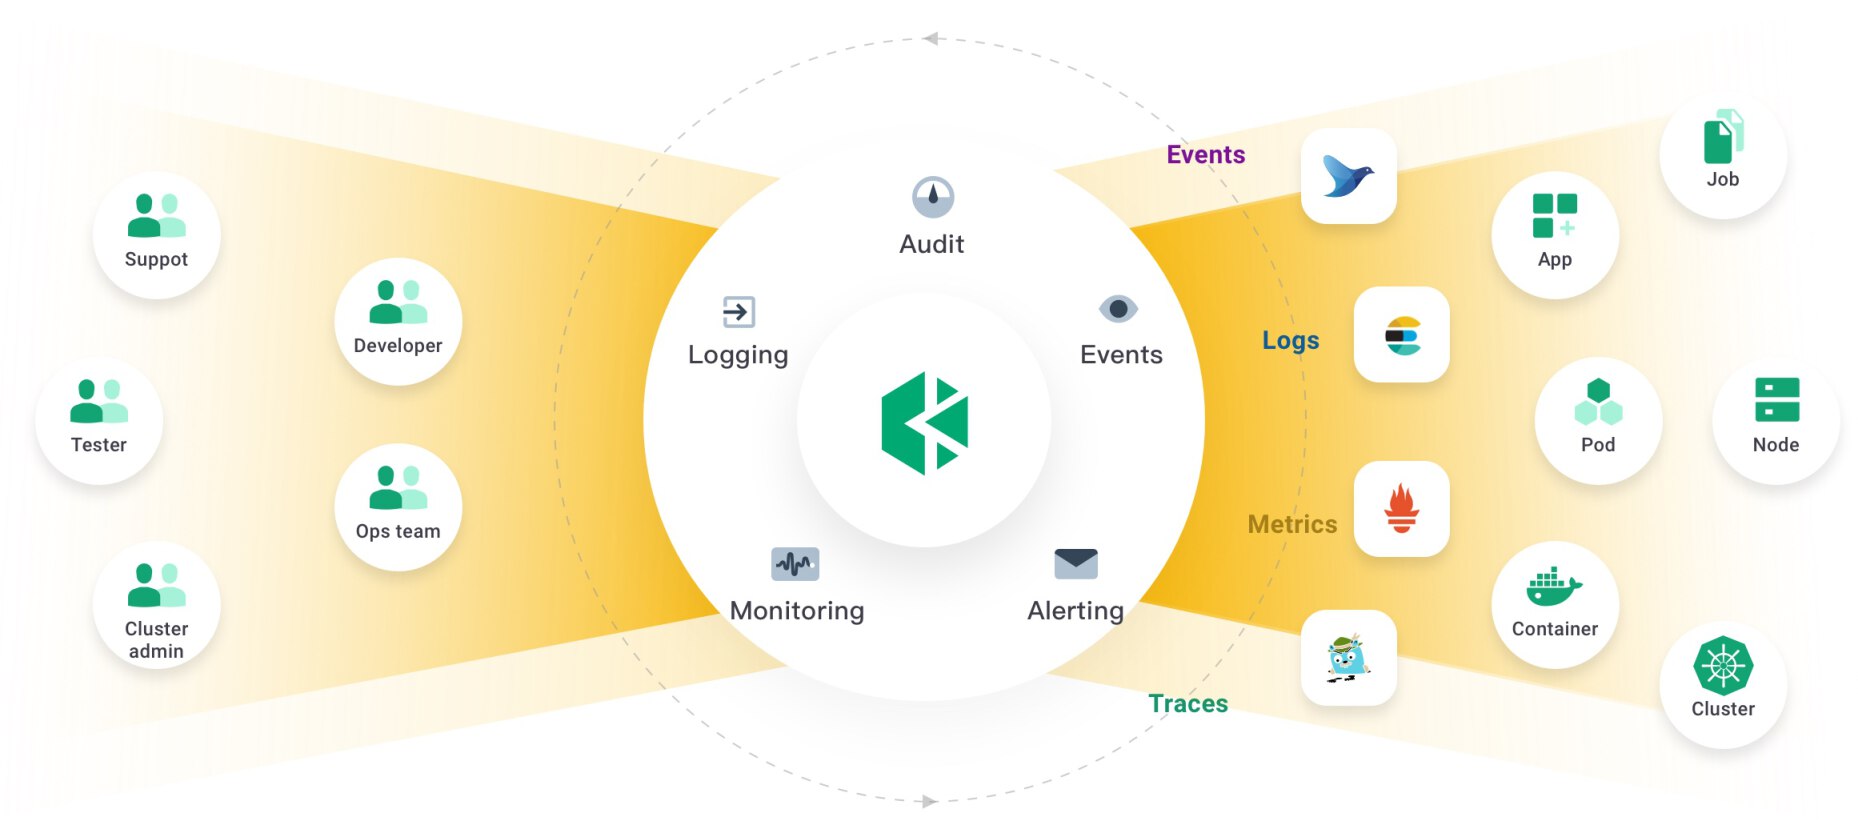
KubeSphere provides rich observability from infrastructure to applications. It integrates your favorite tools for multi-dimensional monitoring metrics, multi-tenant log query and collection, alerting and notification. Try Kubernetes Observability in KubeSphere to realize visualization in a simple way.

Kubernetes Observability and Monitoring, Everything You Need in One Platform
-
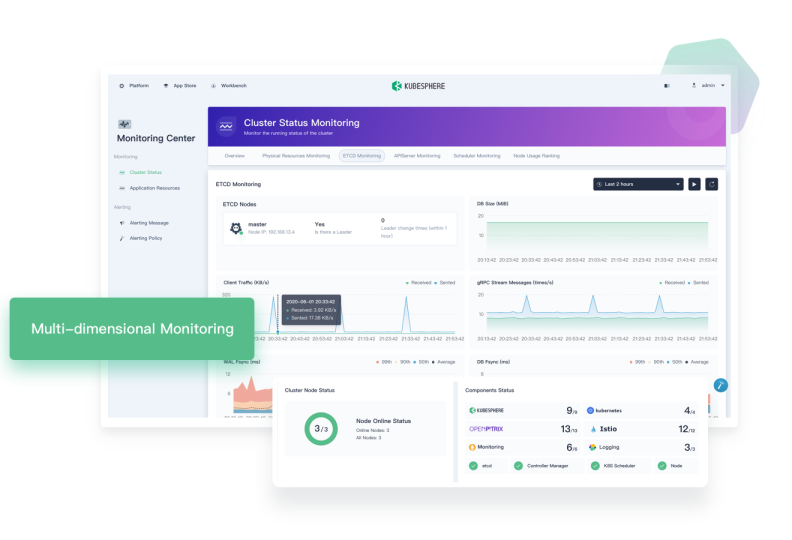
Multi-dimensional Kubernetes Monitoring
- Infrastructure monitoring provides K8s control plane and cluster node metrics
- Application resources monitoring includes CPU, memory, network and storage metrics
- Resource usage ranking by node, workspace and project
- Service component monitoring for users to quickly locate component failures
- Custom metrics support includes application custom metrics dashboard (in v3.0.0)

-
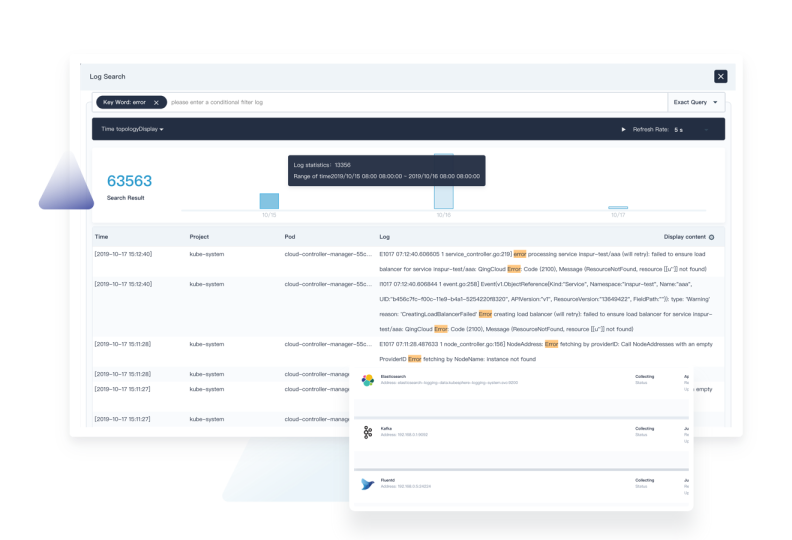
Kubernetes Log Collection and Management
- Multi-tenant log management ensures different tenants can only see their own log information
- Multi-level log queries include projects, workloads, Pods, containers and keywords, supporting drilling into each level to locate the issues
- Support multiple log collection platforms, such as Elasticsearch, Kafka and Fluentd
- Service component monitoring for users to quickly locate component failures

-
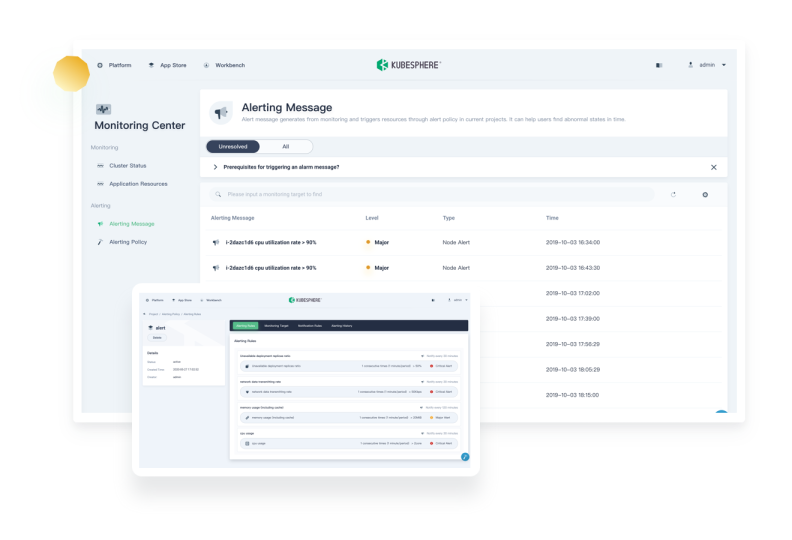
Flexible Kubernetes Alerting and Notification
- Rich alerting rules based on multi-tenancy and multi-dimensional monitoring metrics
- Flexible alerting policy allows you to customize an alerting policy that contains multiple alerting rules
- Multi-level monitoring metrics for alerting, ranging from infrastructure to workloads
- Flexible alerting rules allow you to customize the detection period, duration and alerting priority of monitoring metrics
- Integration with AlertManager supports multiple notification channels (in v3.0.0)


